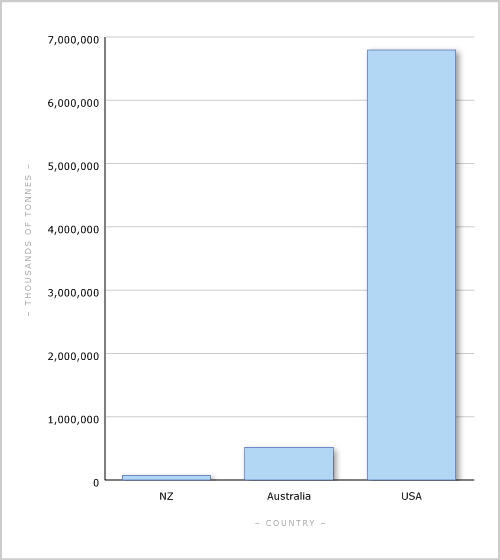
This diagram shows the 2002 emissions of the three main greenhouse gases (carbon dioxide, methane and nitrous oxide) for New Zealand, Australia and the USA. New Zealand’s total emissions are comparatively small. When emissions are adjusted to a per capita basis, New Zealand’s are about average among developed nations, while those of Australia and the United States are high.
Te whakamahi i tēnei tūemi
Te Ara - The Encyclopedia of New Zealand
This item has been provided for private study purposes (such as school projects, family and local history research) and any published reproduction (print or electronic) may infringe copyright law. It is the responsibility of the user of any material to obtain clearance from the copyright holder.
Source: United Nations Framework Convention on Climate Change


Tāpiritia te tākupu hou