


Although a child with intellectual disability or a blind adult with a seeing-eye dog are often the public face of disability, those with severe disabilities are a relatively small proportion of people with disability – around 12%. A more representative image would be someone on a mobility scooter or an elderly person receiving help with heavy housework from a paid caregiver. 2013 research identified that about 24% of New Zealanders lived with disability.
Footpath hazard?
Between 2005 and 2010, 10 elderly people were killed and 19 seriously injured in mobility scooter crashes and accidents, leading some to argue for a form of driver assessment. Nelson transport official Margaret Parfitt said it was ‘a little intriguing to see somebody with a white cane on a mobility scooter.’ The Ministry of Transport acknowledged mobility scooters were an ‘emerging focus for road safety’.1
Disability rates
A 2013 disability survey provided a snapshot of disability in New Zealand.
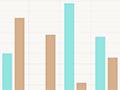
Age
The proportion of the population with disability increased with age: 11% of children (aged 0–14) had a disability, compared to 59% of adults aged over 65. One-third of people with a disability were over 65.
Gender
Overall, males and females had the same disability rate (24%), but the difference between boys and girls was pronounced (13% of boys compared to 9% of girls).
Ethnicity
Māori had the highest rate of disability (24%), followed by Europeans (18%) and Pacific people (17%). The rate for Asian and other ethnicities was 13%.
Adult disabilities
The most common disabilities in adults were:
- mobility – difficulty walking 350 metres (16% of the total population)
- hearing – inability to hear a conversation (10%)
- agility – inability to pick something up from the floor (9%)
- difficulty communicating and doing everyday activities due to a psychiatric or psychological condition (6%)
- difficulty remembering things (5%).
Apart from psychiatric or psychological disabilities, these disabilities were most common in older age groups. Multiple disabilities increased with age.
Child disabilities
In children the most common disabilities were:
- learning disabilities (such as dyslexia) that required use of special education (6% of all children)
- speaking disabilities (4%)
- psychiatric or psychological disabilities (4%).
Causes of disability
Disease and illness were the most common causes of disability in adults (42%), followed by accident or injury (34%) and then natural ageing (31%). In children, conditions present at birth were the most common causes of disability (49%), followed by disease or illness (25%).
Workplace prejudice
While educational qualifications improved the chance of disabled people getting work, their participation rate was lower than that for equally qualified people without disability. People with psychiatric or psychological disability had a relatively low rate of labour-force participation, while those with sensory disabilitiy (seeing, hearing) had participation rates close to those of people without disability.
Employment
Disabled people had a lower rate of employment than people without disability. In 2013, 50% of people aged 15 and over with a disability were in the labour force, compared to 76% of people without a disability.
Support needs
84% of adults and 86% of children with disability had low or medium support needs, such as for help with housework, meal preparation and shopping. Most people with disability lived in private homes; only 4% lived in residential care.
Accessible housing is often a struggle for those with mobility disabilities. People disabled by accident can apply for funding to modify their homes so that they are more accessible. Those disabled through illness or congenital disabilities, or their parents, can apply to the Ministry of Health for funding to make their homes more accessible. This requires assessment by an occupational therapist. As housing costs increase, disabled people needing accessible homes are finding it more difficult to meet their housing needs, especially because they often have lower incomes than non-disabled people.