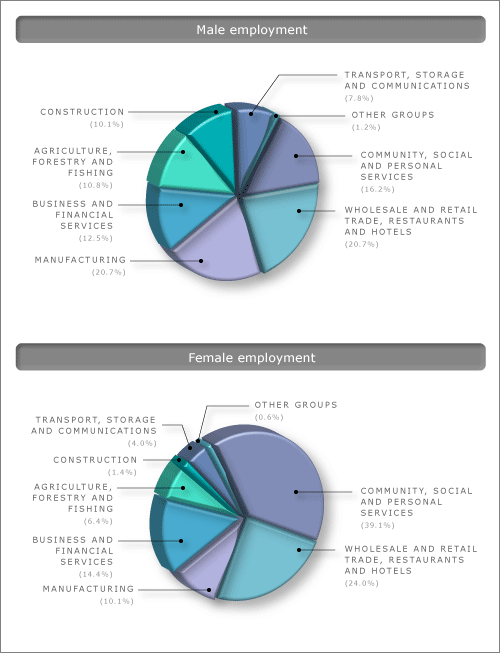
This chart shows the distribution of men and women workers among the major sectors of New Zealand employment. It points up the significance of employment in the service industries, especially for women, and the relatively low levels of employment in manufacturing and agriculture. The figures are based on an annual average for the year ending December 2001.
Te whakamahi i tēnei tūemi
Te Ara - The Encyclopedia of New Zealand
Source: New Zealand Official Yearbook, 2002, p. 327
This item has been provided for private study purposes (such as school projects, family and local history research) and any published reproduction (print or electronic) may infringe copyright law. It is the responsibility of the user of any material to obtain clearance from the copyright holder.