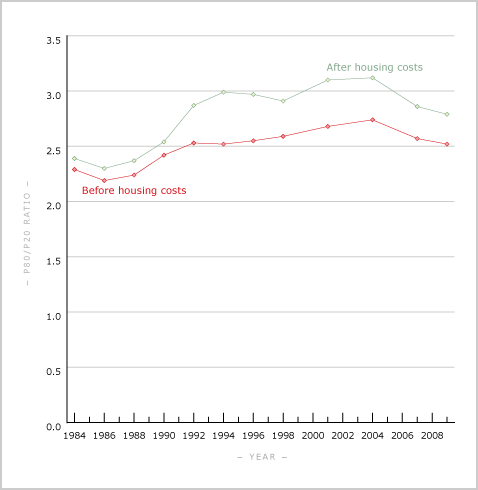
This graph provides another indication of income equality. Using Statistics New Zealand's household economic survey (based on about 3,500 sample households), the graph compares the income of those on the 80th percentile with those on the 20th. The higher the ratio, the greater the level of inequality. The top line shows the difference after deducting housing costs; the bottom line shows the difference including housing costs. The figures suggest that when housing costs are excluded, leaving day-to-day disposable income, there has been some increase in inequality since the late 1980s.
Te whakamahi i tēnei tūemi
Te Ara – The Encyclopedia of New Zealand
This item has been provided for private study purposes (such as school projects, family and local history research) and any published reproduction (print or electronic) may infringe copyright law. It is the responsibility of the user of any material to obtain clearance from the copyright holder.