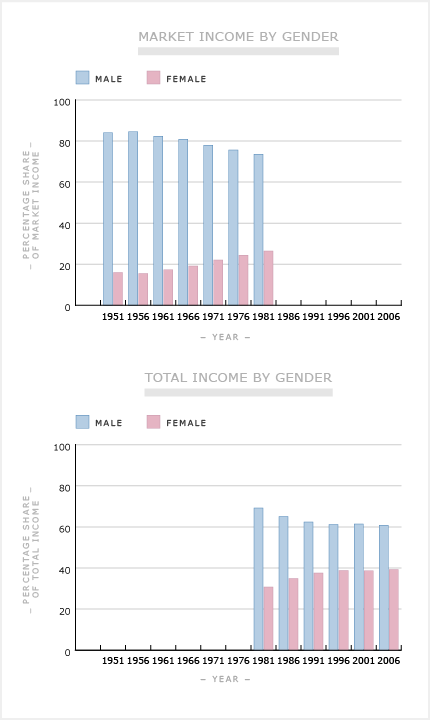
These graphs suggest that in the half-century after 1951 the incomes of men and women became more equal in New Zealand. The figures in the top graph, for 1951 to 1981, are based on market incomes, and do not include taxes or government transfer payments such as benefits. The figures in the bottom graph, from 1981 to 2006, include the transfer payments but not the effect of taxes. The changes in large part reflect the increase in the number of women, especially married women, in the paid workforce.
Te whakamahi i tēnei tūemi
Te Ara - The Encyclopedia of New Zealand
Source: New Zealand census
This item has been provided for private study purposes (such as school projects, family and local history research) and any published reproduction (print or electronic) may infringe copyright law. It is the responsibility of the user of any material to obtain clearance from the copyright holder.