-
1996

-
1999

-
2002

-
2005

-
2008

-
2011

-
2014

-
2017

-
2020
-
2023

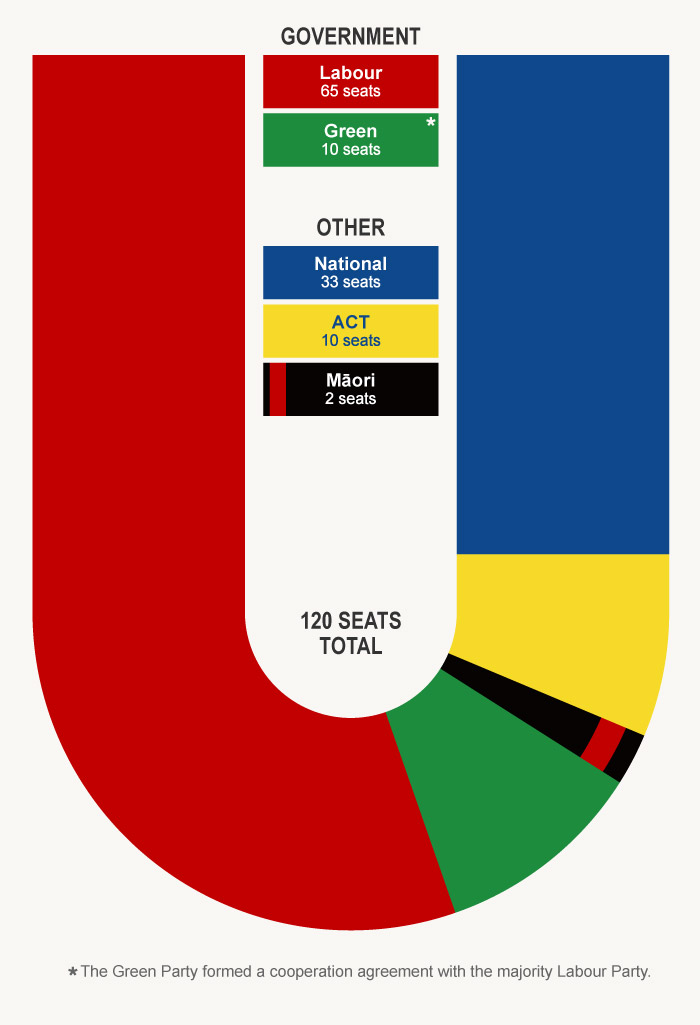
This interactive diagram shows the number of parliamentary seats held by each political party immediately after general elections since the introduction of the mixed-member proportional (MMP) voting system in 1996. These numbers often change during the parliamentary term as a result of the resignation, death or change in party affiliation of an MP.
MMP has lessened the dominance of the major parties. Governments have been formed either as formal coalitions between parties or as a result of agreements in which smaller parties are given ministerial posts outside cabinet in return for signing confidence and supply agreements with the dominant party.
After each of the first seven MMP elections, the largest party in Parliament led the government and its leader became prime minister. In 2017, however, National remained the largest party in Parliament but was consigned to opposition by a coalition between Labour and New Zealand First that was supported by the Green Party. The largest party led the governments formed after the 2020 and 2023 elections.
Using this item
Te Ara - The Encyclopedia of New Zealand
This item has been provided for private study purposes (such as school projects, family and local history research) and any published reproduction (print or electronic) may infringe copyright law. It is the responsibility of the user of any material to obtain clearance from the copyright holder.