

Story summary
Population growth
Between the late 1700s and 2013 the world’s population increased from just under a billion to more than seven billion. In the same period New Zealand’s population increased 40-fold, from 70,000–90,000 people to over four million. It reached five million in 2020.
Migration was the main cause of New Zealand's population growth from the 1850s to the 1870s. After this, natural increase (births minus deaths) was the main cause.
Fertility
Pākehā fertility (the average number of children per woman) was very high in the 19th century, when most women married, and at young ages. From the 1840s to the 1870s each woman had an average of seven live births. Pākehā fertility rates then fell, while Māori rates stayed high. The Pākehā rate increased again from the 1940s to the early 1970s – a period called the baby boom.
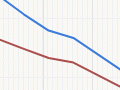
From the 1970s new contraceptive methods were available, and the fertility rate for both Māori and non-Māori fell. In 1980 the total fertility rate fell below replacement level (2.1 births per woman) for the first time, and it has since hovered around this level. In 2017, however, the total fertility rate fell to 1.81 births per woman – its lowest ever level.
Mortality
In the 19th century Pākehā had high life expectancy by world standards. However, the Māori death rate was high, especially for children, and the Māori population fell, mostly because of diseases introduced by Pākehā. From the later 1890s the Māori population began to increase again.
The main causes of death have changed from communicable diseases such as measles and tuberculosis to non-communicable diseases such as cancer. This change happened for Pākehā from the late 19th century and for Māori from the mid-20th century.
In 2014 life expectancy at birth was 80.3 years for New Zealand males and 83.9 years for females. New Zealand males had the 11th highest life expectancy, and females the 21st highest, among countries in the Organisation for Economic Co-operation and Development. Life expectancy for Māori trailed non-Māori by 7.3 years for males and 6.8 for females, although these discrepancies had halved since the mid-20th century.
Age structure
When fertility is high and death rates decline – such as during the baby boom – a high proportion of the population are children. This means relatively fewer people working and more children to support, compared with periods of low fertility. When fertility falls and more people are living longer, a greater proportion is at the older ages and the average age increases. In the 21st century the proportion of the population aged 65 and over is increasing. In the future there are likely to be fewer people paying tax, and more people receiving state-funded superannuation and using health and social services.
Geographic distribution
New Zealand was founded as a farming nation, but by 1916 more people lived in urban areas than rural areas. Employment patterns changed from farming, forestry, fishing and mining to manufacturing and services.
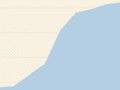
In the late 19th century most people were in the South Island, but since then most people have lived in the North Island. In 2013 one-third of the population lived in Auckland.