
In the late 18th century the world was home to just under one billion people. By 2013 there were more than seven billion. New Zealand experienced an extreme version of this growth. Its population increased from barely 100,000 (Māori) people in 1769 (when British navigator James Cook first visited New Zealand) to over four million by 2013 – a 40-fold increase. The population reached five million in 2020.
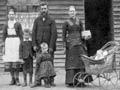
This greater rate of increase for New Zealand has occurred because European settlement of New Zealand started at a time when a period of unprecedented intercontinental migration throughout the world was gathering pace, and also because New Zealand has experienced periods of high fertility.
Ethnic composition
Colonisation not only altered the size of New Zealand's population but also its ethnic composition, from predominantly Māori until 1860 to predominantly Pākehā. Today's multi-ethnic composition is a relatively recent development. In 1991 only 8% of the population was neither Māori or European. By 2013 that had increased to 20%. In the 2013 census 75% of the population claimed European ethnicity, 16% Māori, 12% Asian, 8% Pasifika and 1% Middle Eastern/Latin American/African.
The composition of New Zealand's population has changed as a result of 'demographic transition'.
Demographic transitions
The classic model of demographic change starts with a movement from relatively high death rates and birth rates (and therefore low rates of natural increase) to a phase where fertility remains high but mortality declines, accelerating rates of natural population increase. In the next phase fertility also declines, causing growth to slow. The final stage, which is found in most developed countries, is for low birth and death rates, leading to low or natural increase or even natural decrease. Pākehā followed this model from the 19th century. For Māori this demographic transition was delayed until the second quarter of the 20th century, but accelerated faster than the Pākehā model once it started.
Population growth
Migration, fertility and mortality all influence population growth.
Migration was the main cause of population growth from the 1850s to the 1870s. After this, natural increase (births minus deaths) became the main cause of growth in most years. From 2013 record migration gains led to migration once again becoming the main source of growth, but this may be temporary.
Contribution to growth has differed by ethnicity. Pākehā fertility was very high through most of the 19th century but dropped in the last few decades of that century. It reached a low point during the 1930s economic depression, when it hovered just above replacement level (which is 2.1 births per woman). Fertility increased during the post-Second World War ‘baby boom’ (from the mid-1940s to the early 1970s), when there were about four births per woman. Fertility dropped again after the baby boom because a wider range of contraceptive methods became available, enabling women to control their fertility. Fertility has remained at or just below replacement level since the late 1970s. In 2013 women of European origin had an average of 1.92 births per woman and these births accounted for just over 60% of all births.
Pākehā life expectancy was high by world standards in the 19th century because of favourable living conditions. High life expectancy continued into the 21st century, though the main causes of death have changed over time.
Increasing life expectancy and low fertility rates are expected to continue in the 21st century. The population will continue to grow but not as fast as in previous centuries. New Zealand’s total fertility rates remain high compared to other OECD countries. In 2014 they were sixth-highest at 1.9 births per woman, well above the OECD average of 1.7.
Changes in population structure
Population structure refers to categories within a population. Important elements include age structure, dependency (the notional support burden placed on the working-age population by younger and older people), labour-force composition and geographical distribution.
Among Pākehā, the working-age population (15–64) has always been the largest age category, but the proportion of children and older people (65 and over) has varied. The child population was high in the late 19th century and in the wake of the post-Second World War baby boom. The older population grew significantly in the late 20th century and is expected to be larger than the child population by the 2020s. Changing age structures impact on dependency ratios.
A majority of New Zealanders were urban by the early 20th century. This change from rural to urban was linked to changes in employment. The secondary (manufacturing) and tertiary (service) sectors, which are predominantly urban-based, both employed more people than the primary sector (farming, forestry and mining, mainly rurally based) by the 1920s.
Māori population change
Māori were the largest ethnic group until the 1860s, but the Māori population had already been declining for a number of decades, mainly because of exposure to new infectious diseases with the arrival of Europeans. The Māori population grew again from the late 1890s and has maintained an upward trend. Population growth occurred because of improvements in mortality rates and a consistent and relatively high fertility rate (compared to Pākehā).
Until the 1980s the Māori child population was close in size to the working-age population. Since then it has continued to grow, but the working-age population has grown even faster – although the size difference between the two groups is smaller than for those of European descent. The older proportion of the Māori population is small compared to the European population, but it will grow significantly in the 21st century as life expectancy increases and fertility rates continue to fall.
In 2013 the Māori fertility rate was 2.49 births per woman and Māori births accounted for 22% of all births. In 2014 life expectancy was 73 years for Māori males and 77.1 years for Māori females. Life expectancy for Māori trails that of non-Māori by 7.3 years for males and 6.8 years for females, although these discrepancies have halved since the mid-20th century.
Māori have been predominantly urban dwellers since the 1960s, which is associated with a move into the secondary and tertiary employment sectors.
Other ethnic groups
Although New Zealand has long been a country of migration, most migrants were of European origin until the late 20th century. As recently as 1991 only 8% of the New Zealand population was not of European or Māori origin. This situation has changed dramatically since. In 2013 almost 900,000 New Zealanders were of Asian or Pasifika descent, up from under 300,000 at the 1991 census. A further 53,000 were of Middle Eastern, Latin American or African origin, up from less than 20,000 in 1996.
Since the 1990s these three ethnic groups have grown at a faster rate than either European or Māori. Between 1996 and 2013 Asian people accounted for almost half of all growth, more than European (33%), Māori (17%), Pasifika (16%) and Middle Eastern/Latin American/African (5%).
The majority of Asian, Pasifika and Middle Eastern/Latin American/African New Zealanders are more likely to live in a city than European or Māori. In 2013, 90% of Asian peoples and 87% of Pasifika and Middle Eastern/Latin American/African peoples lived in a city compared with Europeans (63%) and Māori (53%).
Births data suggest that the total fertility rates of Pasifika and Asian women in 2013 were 2.73 and 1.69 births per woman respectively. Pasifika births accounted for 12% of all births, and Asian births 15%. Life expectancy statistics are available for Pasifika only. In 2013 life expectancy at birth was 74.5 years for Pasifika males and 78.7 years for Pasifika females.