How multibeam echo sounders work
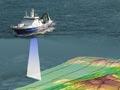
The widespread use of multibeam echo sounders since the 1990s has revealed the seabed in unprecedented detail. Unlike normal echo sounders, which direct a single beam of sound to the seabed directly below a survey vessel, multibeam systems emit a fan of sound beams. By this method, a wide area of the seabed can be scanned in high detail.
Multibeam and climate change
As the climate gets warmer the ocean around New Zealand will change. Higher sea levels, increased winds, stronger storms and more intense rainfalls will leave their mark on the seabed and coast. A major storm off Wellington, for example, could shift sand and gravel, destroying old habitats and creating new ones. An event like Cyclone Bola could blanket the continental shelf with a thick layer of fluid mud. As multibeam systems can precisely map the seabed, it is possible to form baseline charts against which such future changes can be measured.
Fan width increases with water depth. At 2,000 metres the fan covers an 11-kilometre-wide strip of seabed. As the vessel sails along the survey line, several million depth soundings are collected for every kilometre. In a single day, over 3,500 square kilometres can be charted. When this is matched with the precision of modern global positioning systems, for the first time it is possible to rapidly survey large areas with exactitude.
Discoveries continue to be made. In October 2004, 12 underwater volcanoes were mapped for the first time during a multibeam survey by the Tangaroa.
Multibeam data
The vast amount of data captured by multibeam systems are recorded and processed on the survey ship. Special software allows preliminary charts to be plotted within hours. However, a range of corrections and checks are required before final charts are produced.
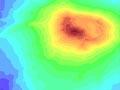
Multibeam data allows oceanographers to chart many different aspects of the ocean floor:
- Depth can be shown as plots of selected soundings, as contours, or as colour-coded charts.
- Seabed shape can be realistically depicted as a shaded relief model.
- Slopes can be precisely measured and mapped to allow engineers, for example, to analyse seabed stability.
- The type and distribution of sediment and rocks can be gauged by recording the strength of the returning echoes (called backscatter). Weak echoes are often associated with soft mud because it absorbs some of the sound's energy. Rocks absorb little energy and produce strong echoes.