
Surveys and ships
New Zealand has the world’s fourth largest Exclusive Economic Zone (the water and sea floor over which the country has legal jurisdiction and resource rights). Covering more than 4 million square kilometres, it is the country’s most extensive environment, but also its least known. While coastal waters were systematically surveyed as part of early settlement and trade, the deep ocean was not charted until much later. One of the earliest ocean charts is dated 1895. It was based on data collected on the Challenger expedition of 1872–76, the first world-wide ocean survey. But depth soundings were scattered, and only a few large seabed features were identified.
Surveys expanded over the next 60 years as more naval and research ships visited the region. The period following 1949 saw the deployment of the hydrographic ship Lachlan, the creation of the New Zealand Oceanographic Institute, and frequent visits by foreign research vessels, especially the United States research ship Eltanin. As a result, by 1967 a broad outline of the ocean floor around New Zealand had been charted.
Even so, much detail remained unknown. From the 1970s, efforts by the Royal New Zealand Navy ship Monowai, the New Zealand Oceanographic Institute’s ships Tangaroa and Rapuhia, and the National Institute of Water and Atmospheric Research ship, also named Tangaroa, have revealed a host of features, which featured in the 1998 chart, Undersea New Zealand.
Undersea New Zealand
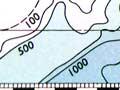
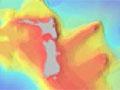
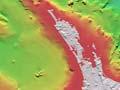
The award-winning chart Undersea New Zealand provided a new view of the seabed. To construct the chart, depth and navigational data were collected and inspected for errors. Computer software converted the data into a shaded relief model, revealing with great clarity the shape of the ocean floor. Colour indicated water depth, which ranges from the shallow continental shelf (0–150 metres) to ocean trenches where depths exceed 5,000 metres. The land topography was also presented to emphasise the continuity between land and sea.
Technology
Initially imprecise and slow, surveys have improved remarkably. James Cook gauged water depth by lowering a weighted, calibrated rope or lead line to the seabed – a method used since ancient Egyptian times. To fix position, Cook relied mainly on a sextant and ship's clock. Between fixes, the ship’s position was estimated from its speed and course; a process called dead reckoning.
When the Challenger arrived in Wellington in 1874, it opened a new era of depth-finding, this time by sounding machine. Although it used a weight similar to a lead line, the machine was quicker and more accurate as it mechanically measured the line as it wound onto a drum.
The invention of the first effective echo sounder around 1922 improved the accuracy and speed of gauging depth. In 1924 the development of radio-based positioning helped coastal navigation, but in the open ocean, navigators still relied on sextants.
This limitation was overcome in the 1960s with the launch of the first navigational satellites. By 1974, New Zealand naval and oceanographic ships operated satellite systems that typically gave positions to within 500 metres of a location. Positioning was better in coastal waters, where radar and microwave systems had accuracies to within 1 metre. The 1970s also saw the first commercial multibeam echo sounder, which heralded a new era of seabed mapping.