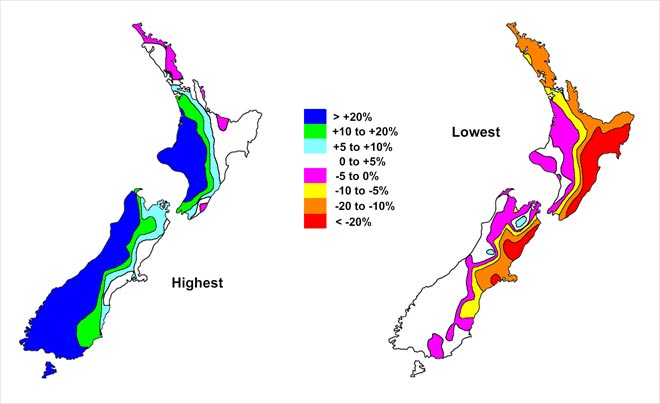
These maps show the range of predicted changes in New Zealand’s annual mean rainfall between the 1980s and the 2080s. The left map assumes the effect of global warming based on the highest projection of the Intergovernmental Panel on Climate Change (IPCC). Under that scenario the rainfall increases substantially in the west of both islands. The right map is based on the lowest prediction. Under that prediction the east coasts become significantly drier. Either way climate change will have clear impacts on New Zealand farming and economic activity.
Using this item
NIWA – National Institute of Water and Atmospheric Research
This item has been provided for private study purposes (such as school projects, family and local history research) and any published reproduction (print or electronic) may infringe copyright law. It is the responsibility of the user of any material to obtain clearance from the copyright holder.