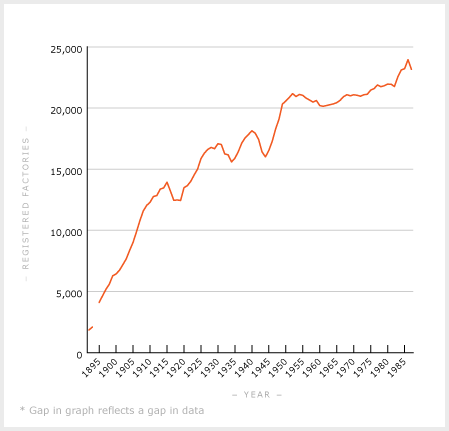
This chart illustrates the increasing number of factories between 1892 and 1987. The growth in factory size, which can be measured by the average number of people employed in them, is not shown. Between 1951 and 1971, for example, workers per factory went from 17.1 to 23.7.
The data on which the graph is based was collected by the Department of Labour, which stopped doing so in 1987. The definition of ‘factory’ used by the department was very broad – any workplace with more than one person was included – so the figures indicate a trend rather than actual numbers.
Using this item
Te Ara - The Encyclopedia of New Zealand
This item has been provided for private study purposes (such as school projects, family and local history research) and any published reproduction (print or electronic) may infringe copyright law. It is the responsibility of the user of any material to obtain clearance from the copyright holder.
Source: John E. Martin, Holding the balance: a history of New Zealand's Department of Labour, 1891-1995. Christchurch: Canterbury University Press, 1996, pp. 378–380


Add new comment