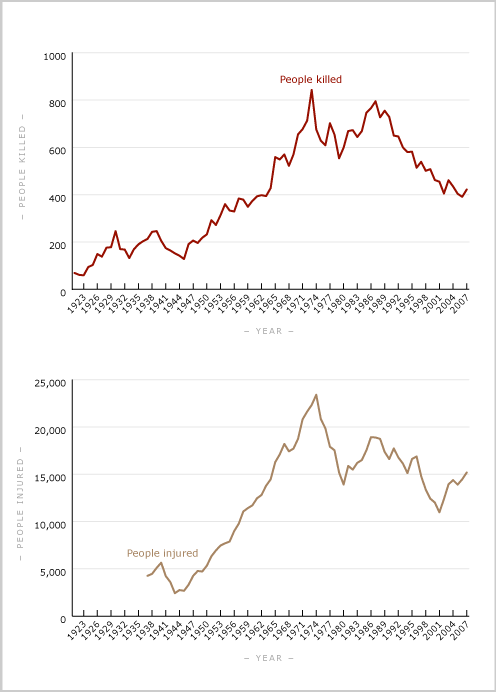
These graphs show the rise in numbers of people killed (top) and injured (bottom) on the roads from the 1920s to the 1970s. The increase can be attributed to more motorists, more vehicles, and other factors such as speed, non-use of seatbelts, and driving under the influence of drugs or alcohol. Deaths reached a peak in 1973, but declined following safety campaigns and stricter policing. However in the early 2000s, the number of people injured increased markedly.
Using this item
Te Ara - The Encyclopedia of New Zealand

This item is licensed under a Creative Commons Attribution-NonCommercial 3.0 New Zealand Licence
Source: Ministry of Transport


Add new comment