-
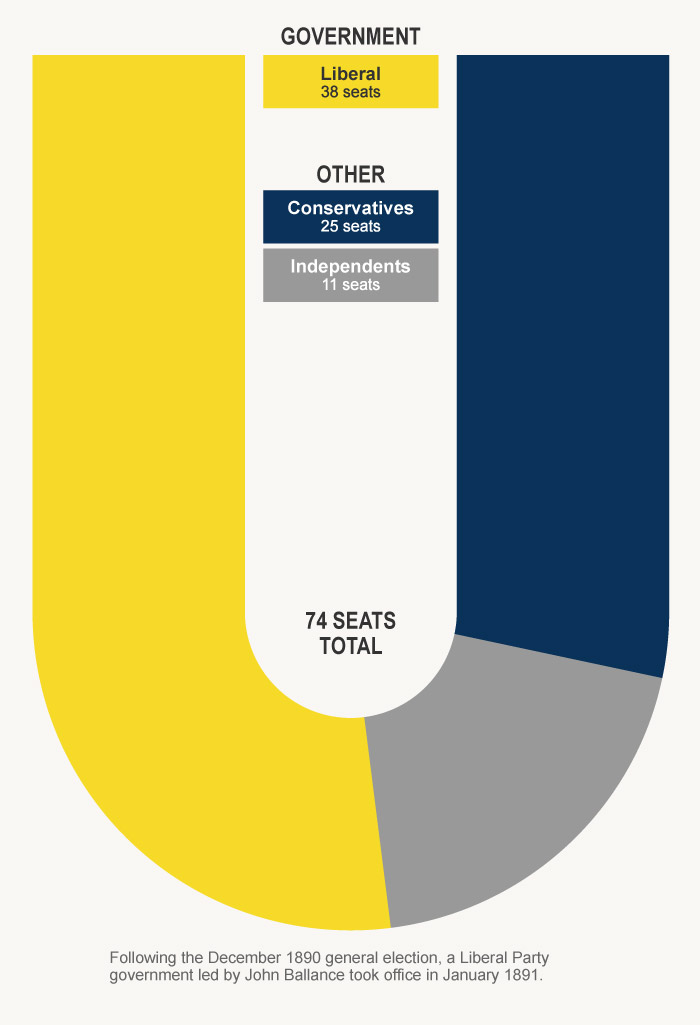
1890
-
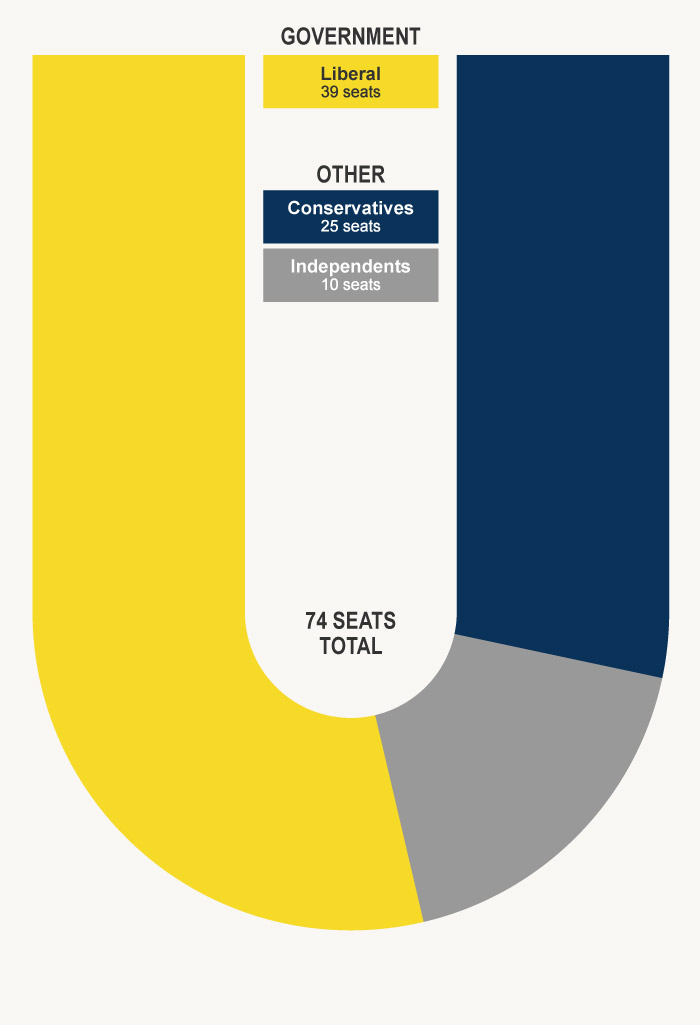
1893

-
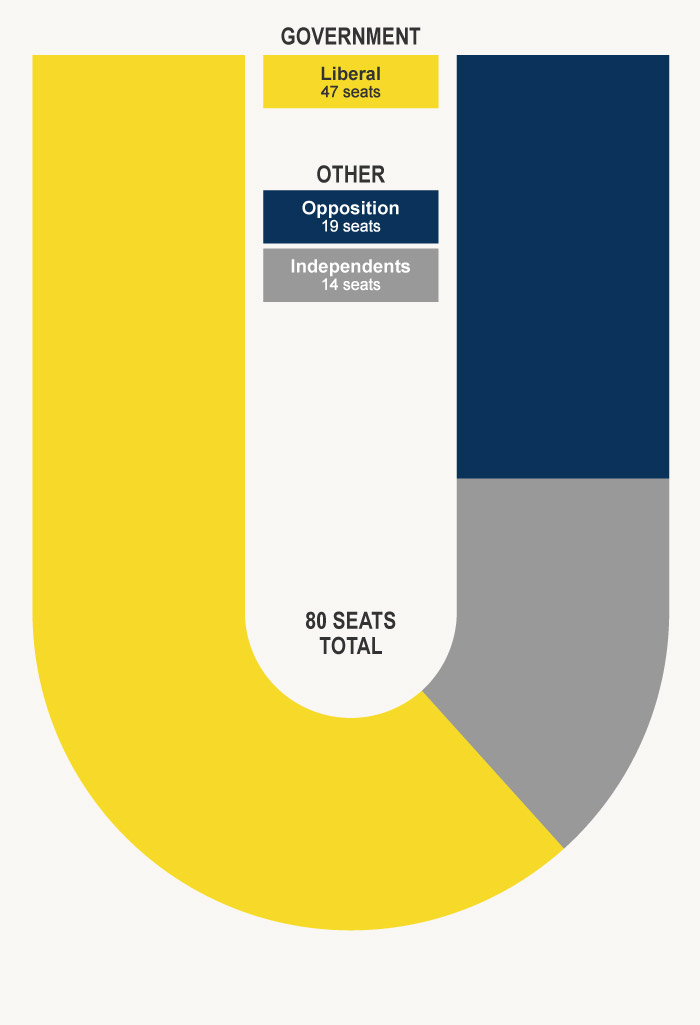
1896
-
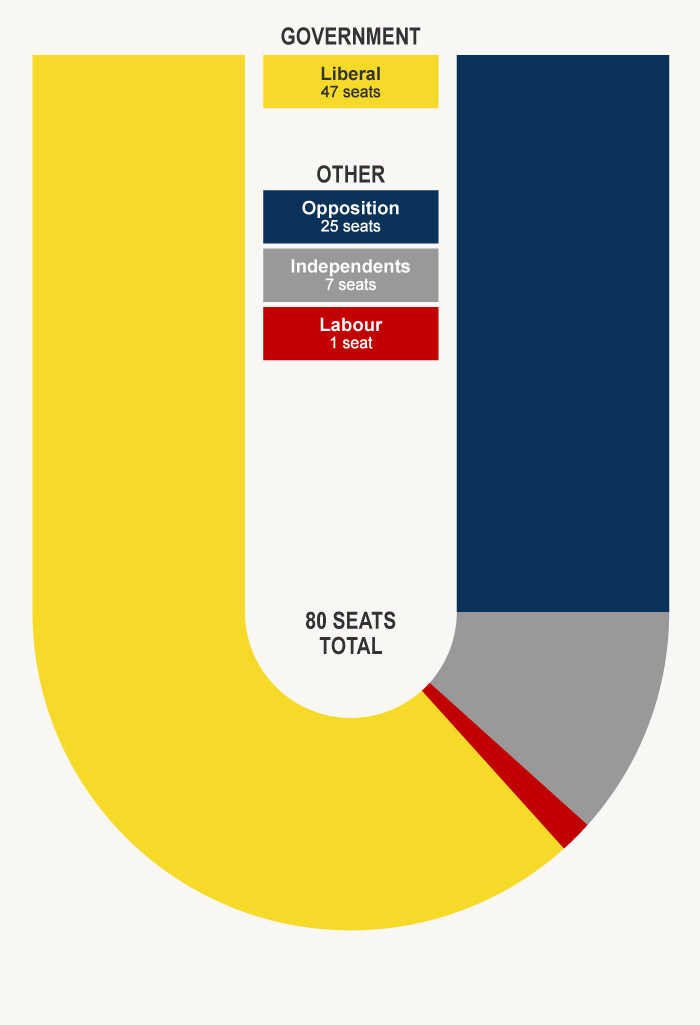
1899

-
1902
-
1905

-
1908
-
1911

-
1914
-
1919
-
1922
-
1925
-
1928
-
1931
-
1935
-
1938
-
1943
-
1946
-
1949
-
1951
-
1954

-
1957
-
1960

-
1963
-
1966
-
1969
-
1972

-
1975

-
1978
-
1981
-
1984
-
1987

-
1990
-
1993

-
1996

-
1999

-
2002

-
2005

-
2008

-
2011

-
2014

-
2017

-
2020
-
2023

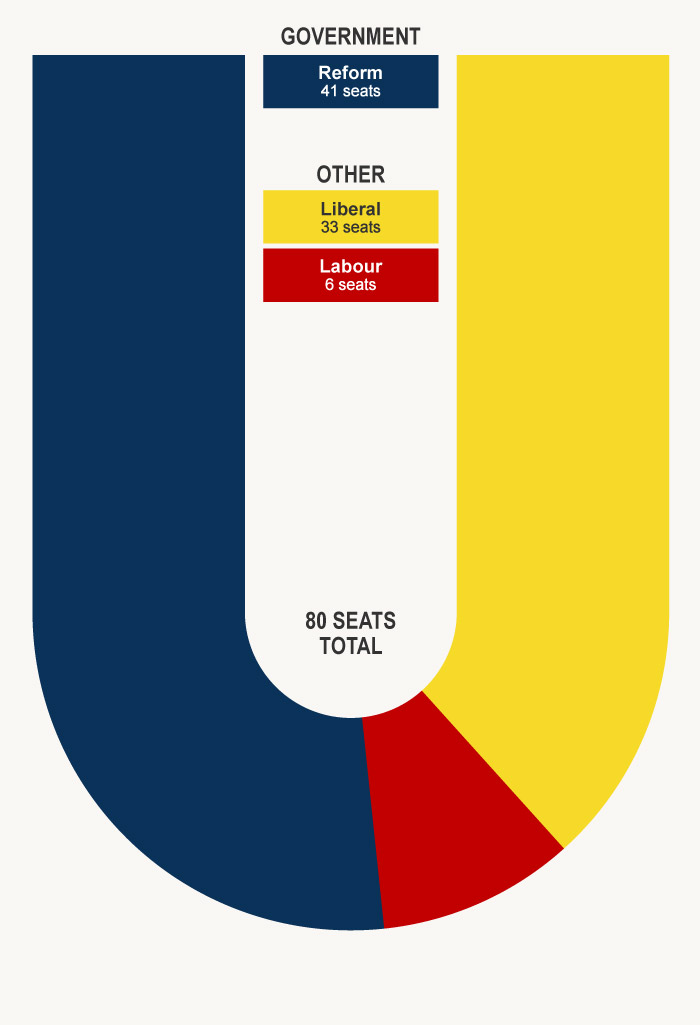
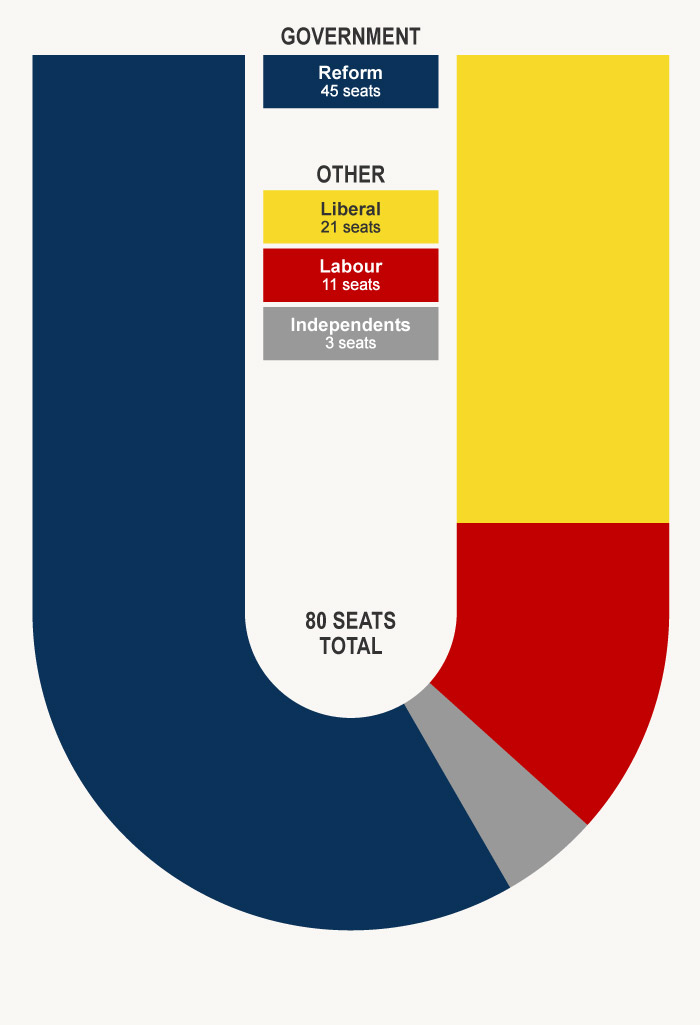
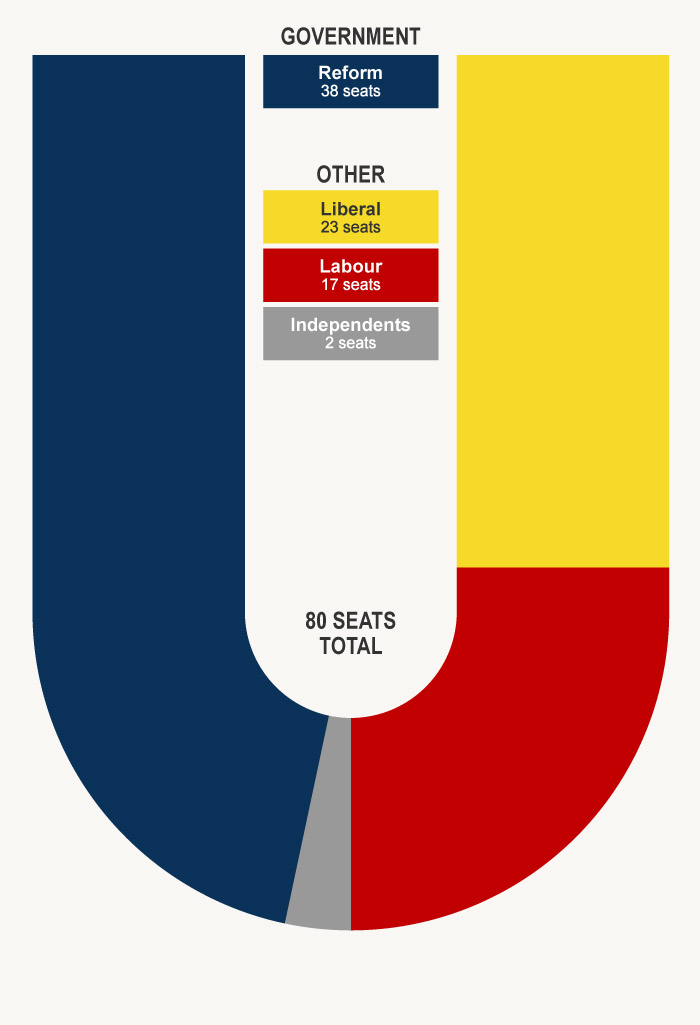
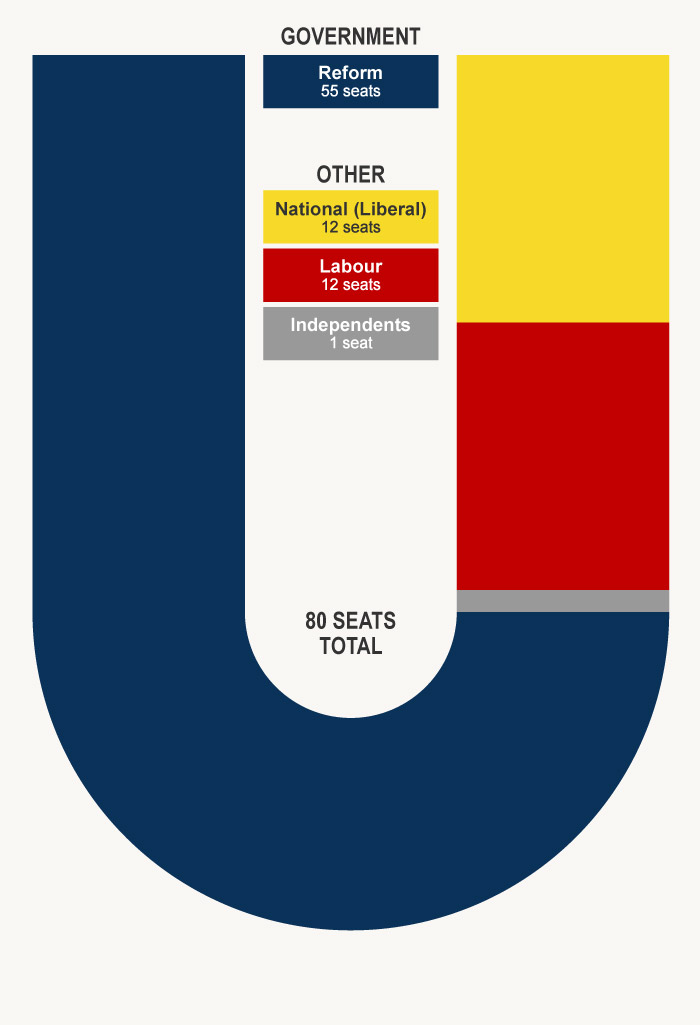
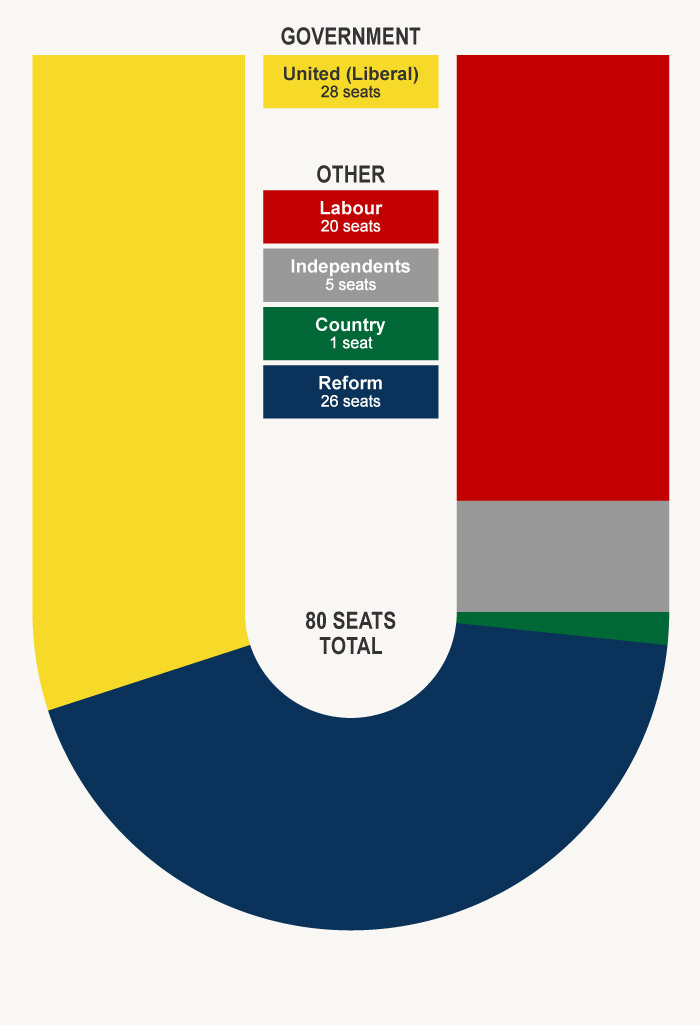
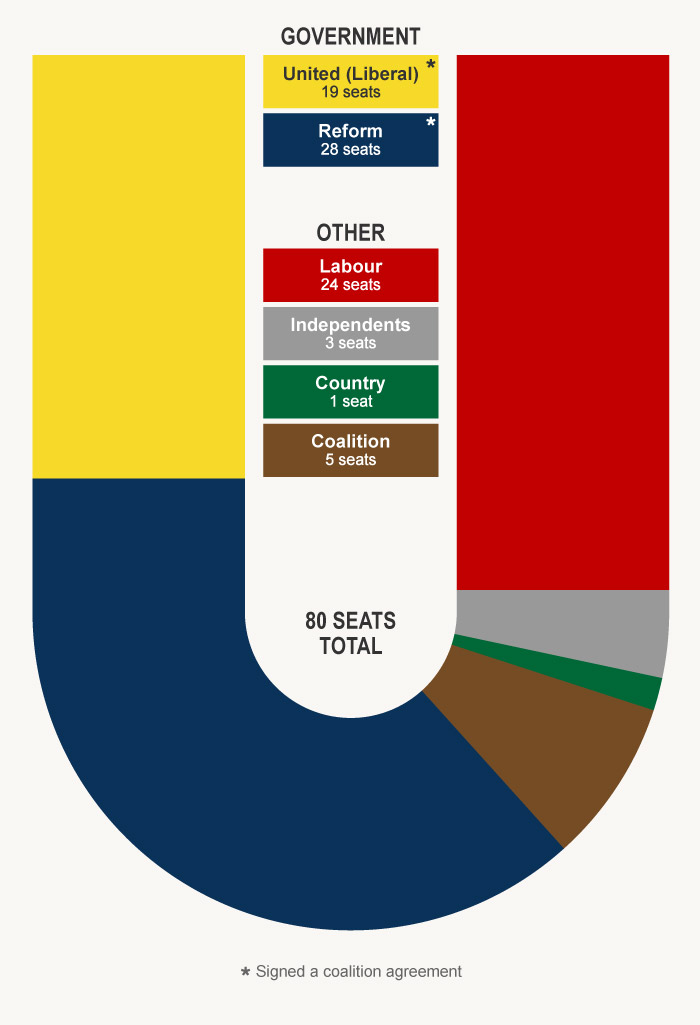
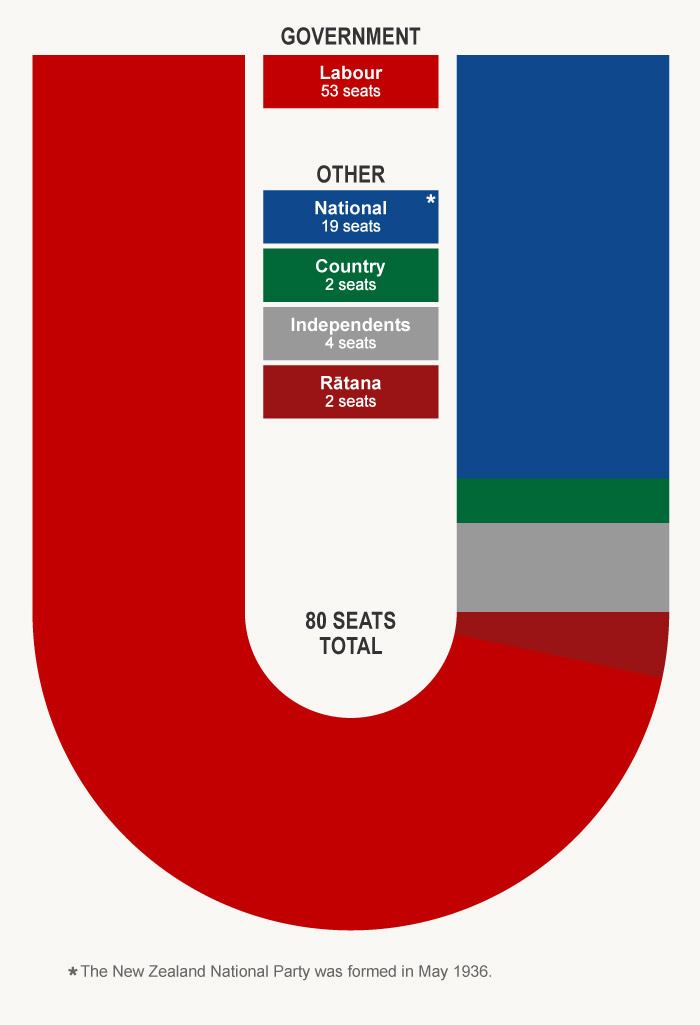
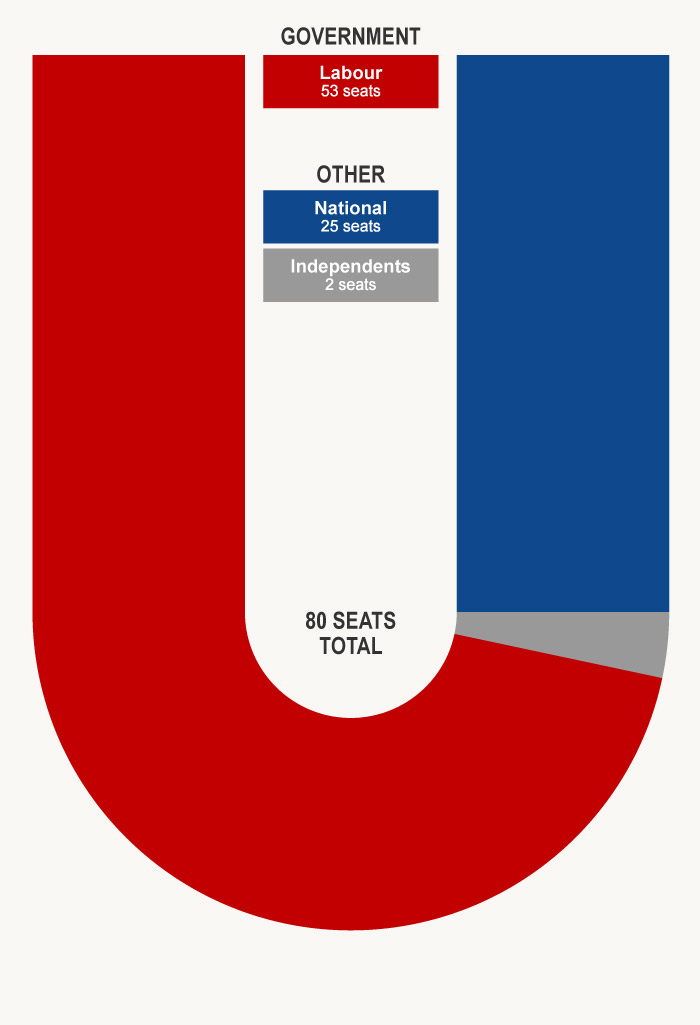
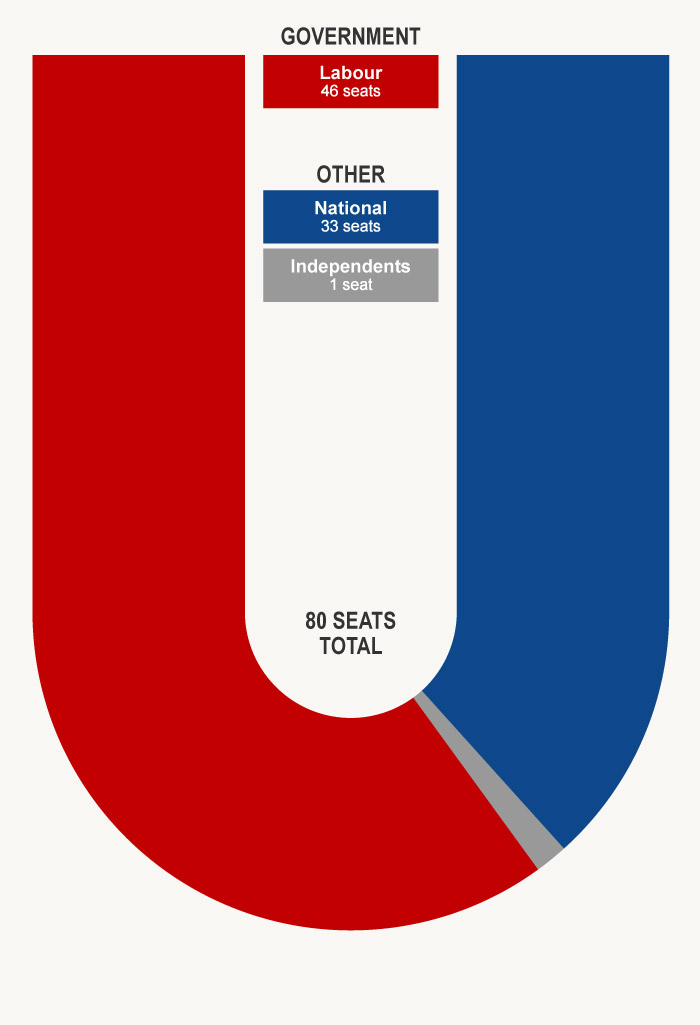
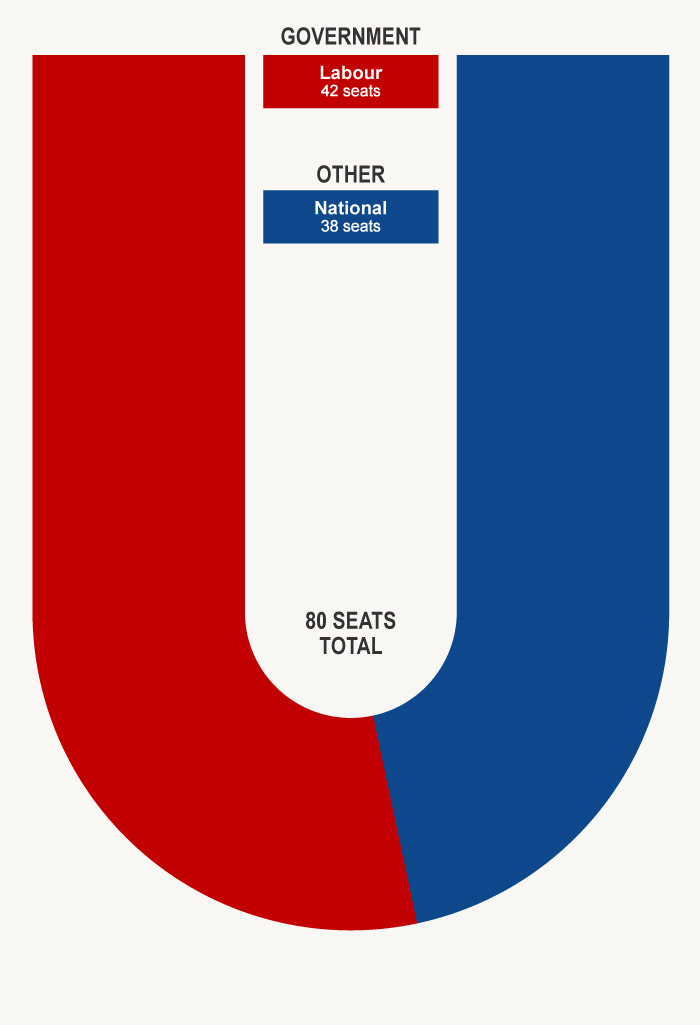
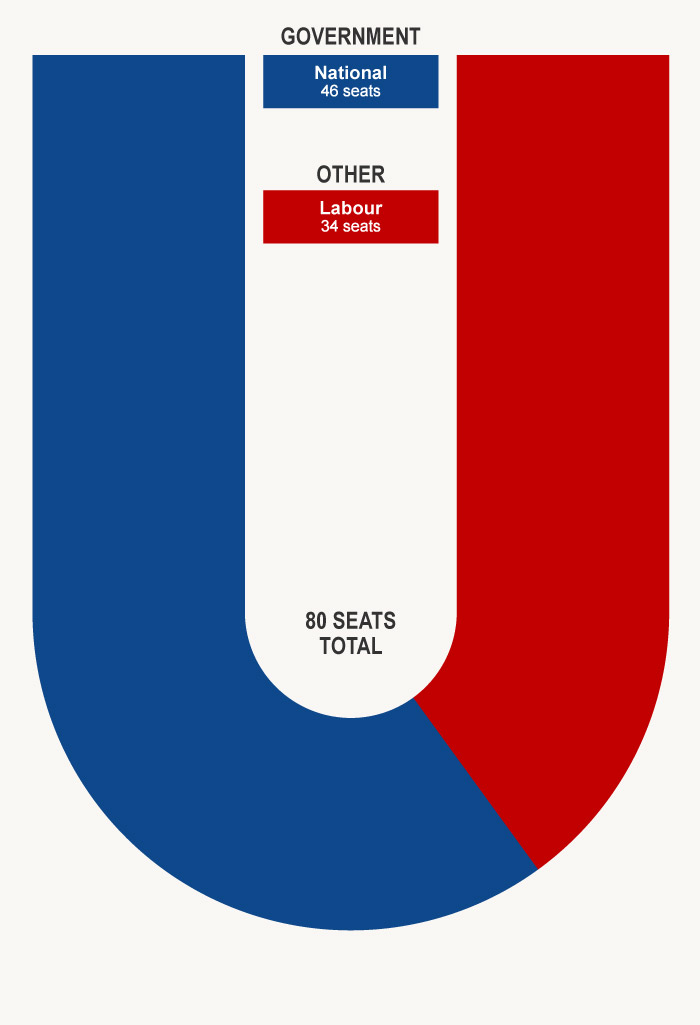
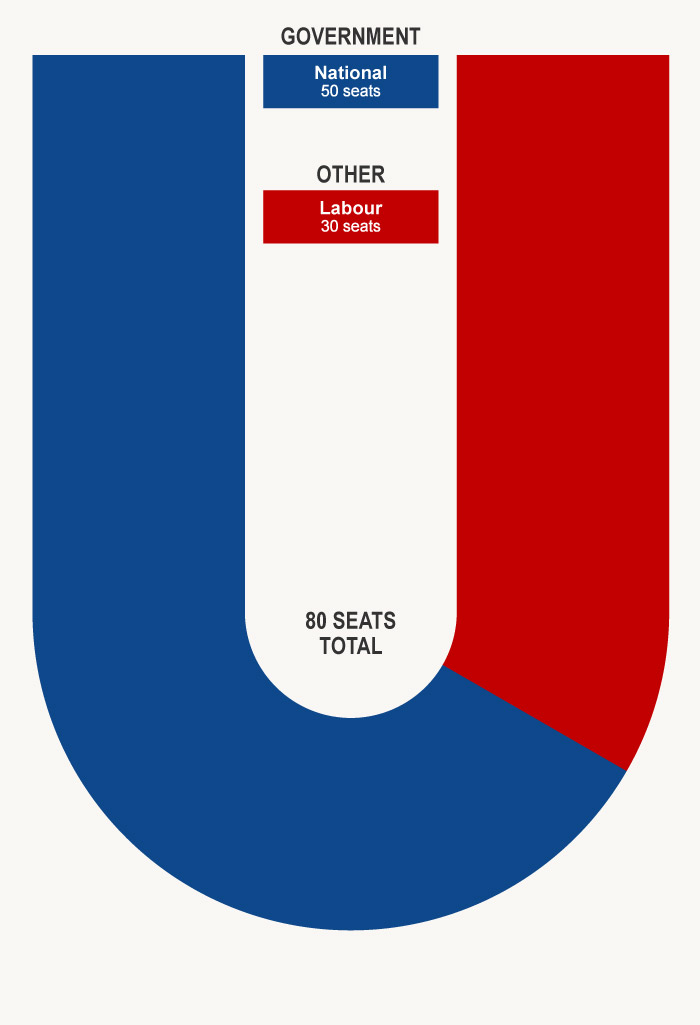
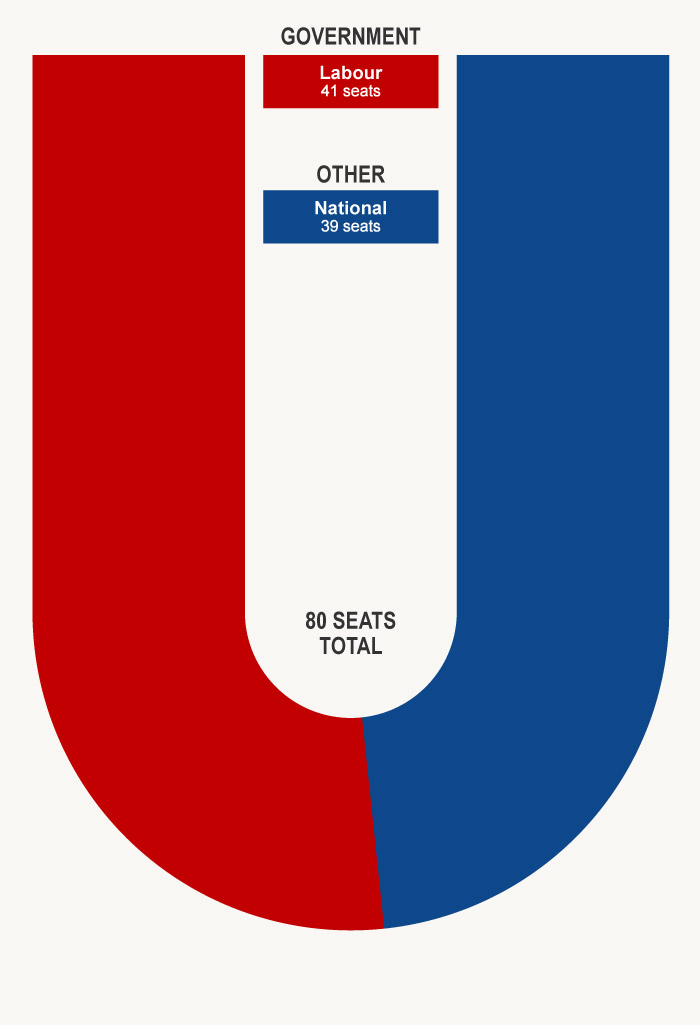
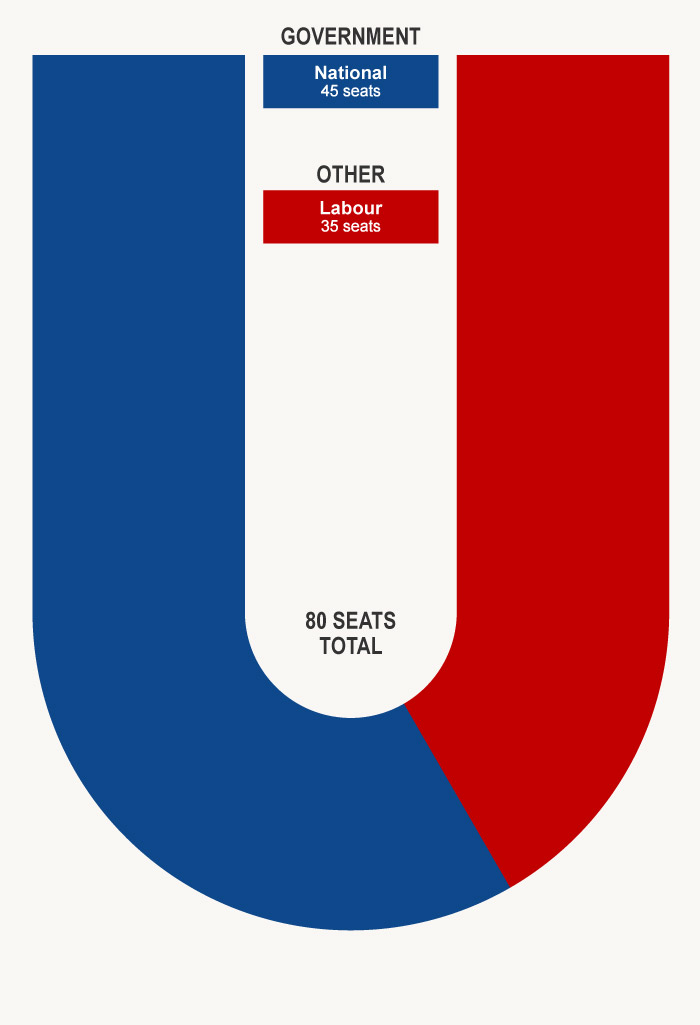
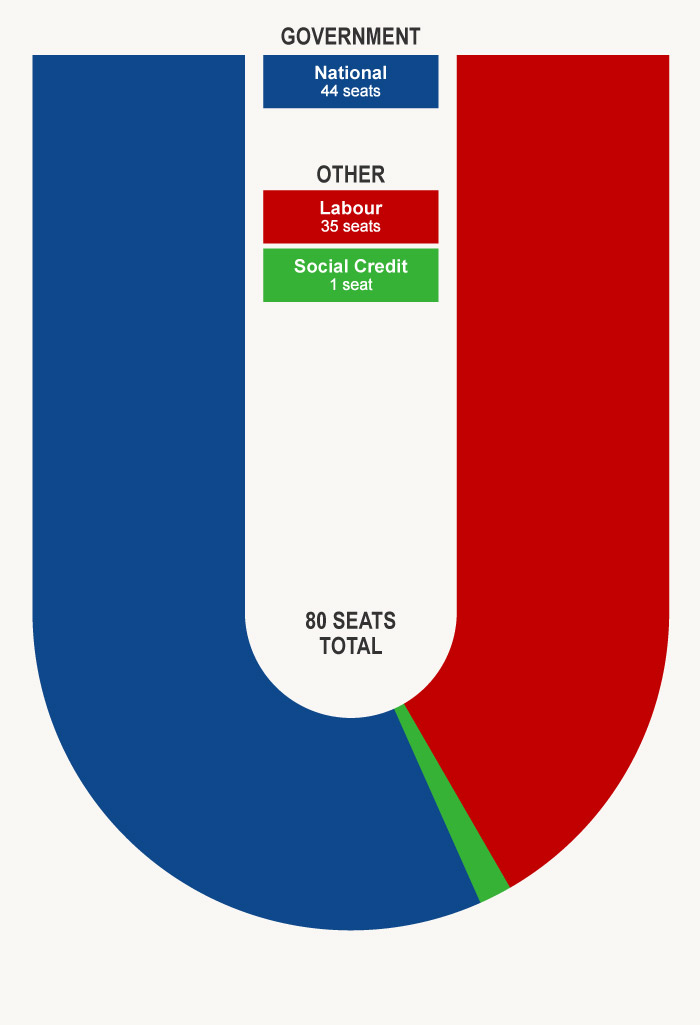
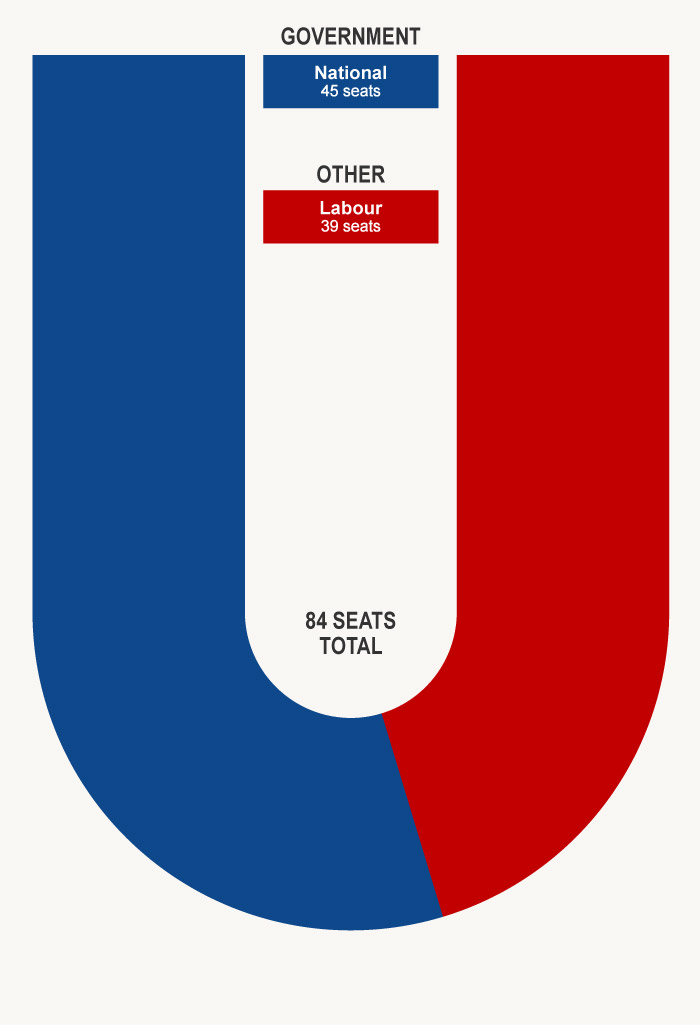
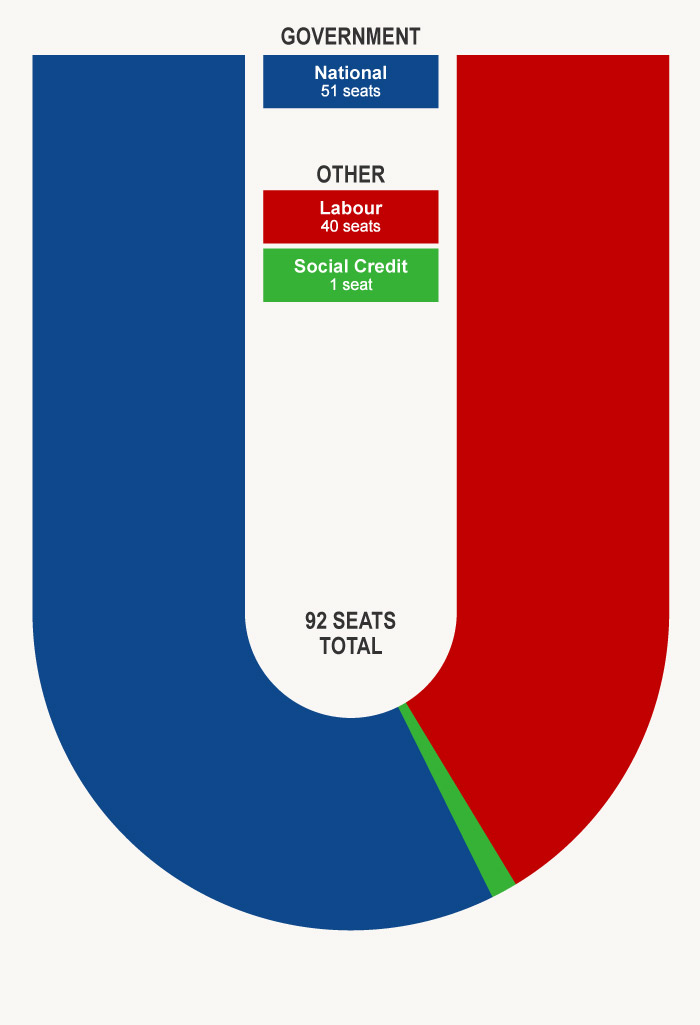
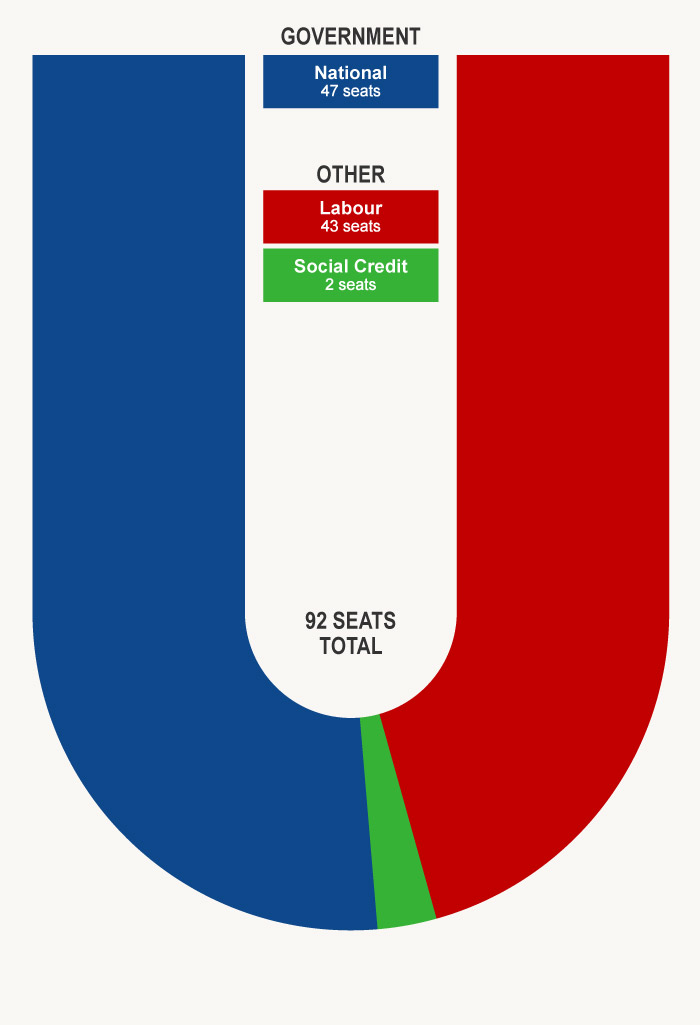
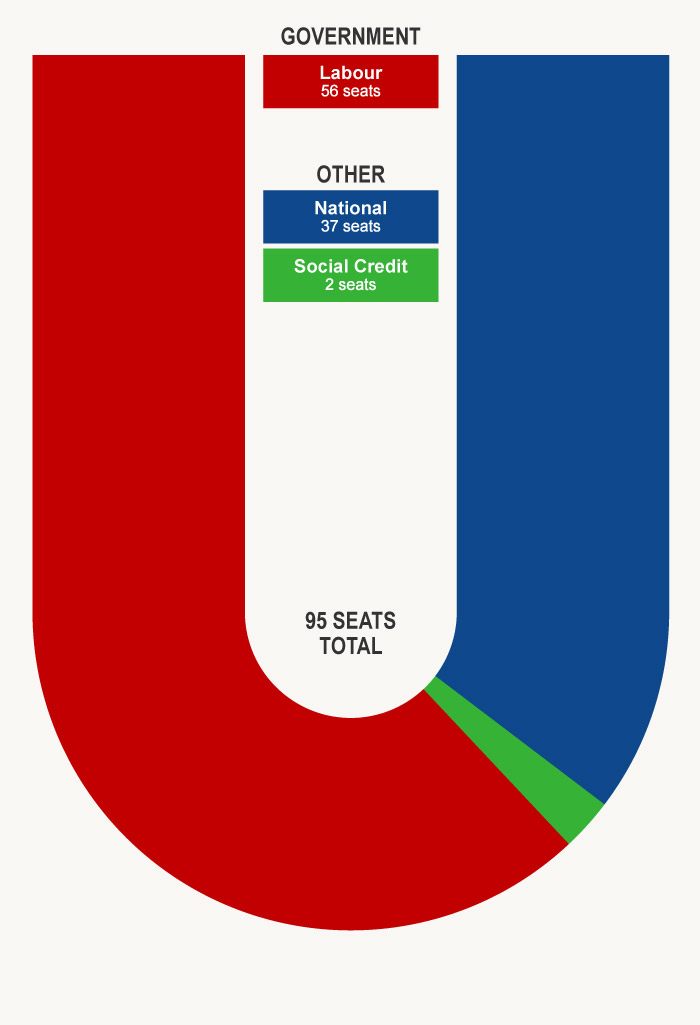
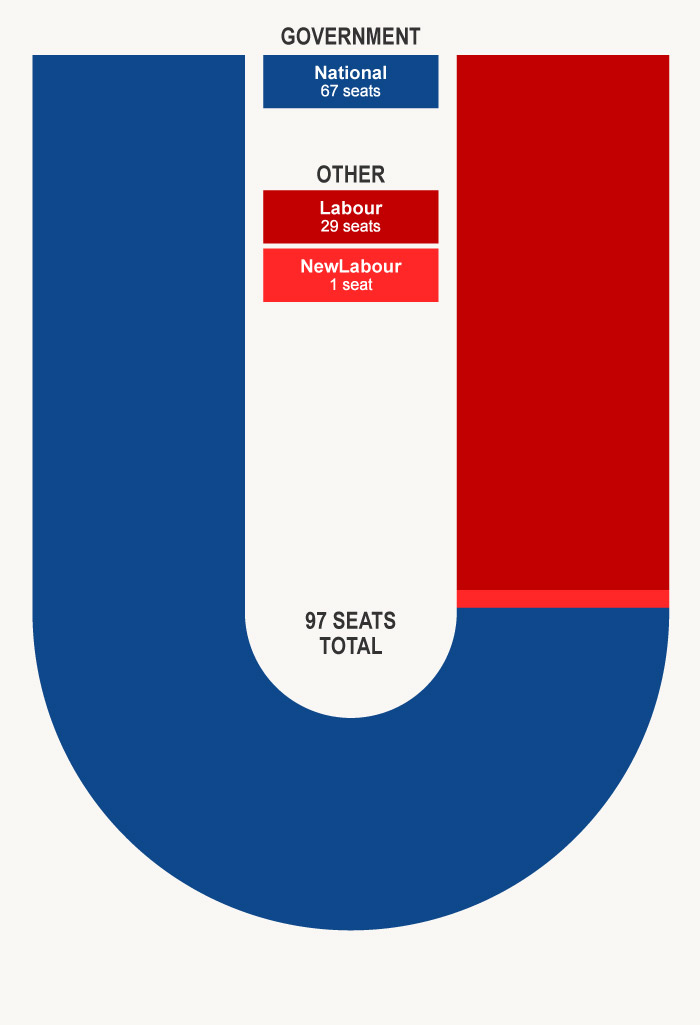
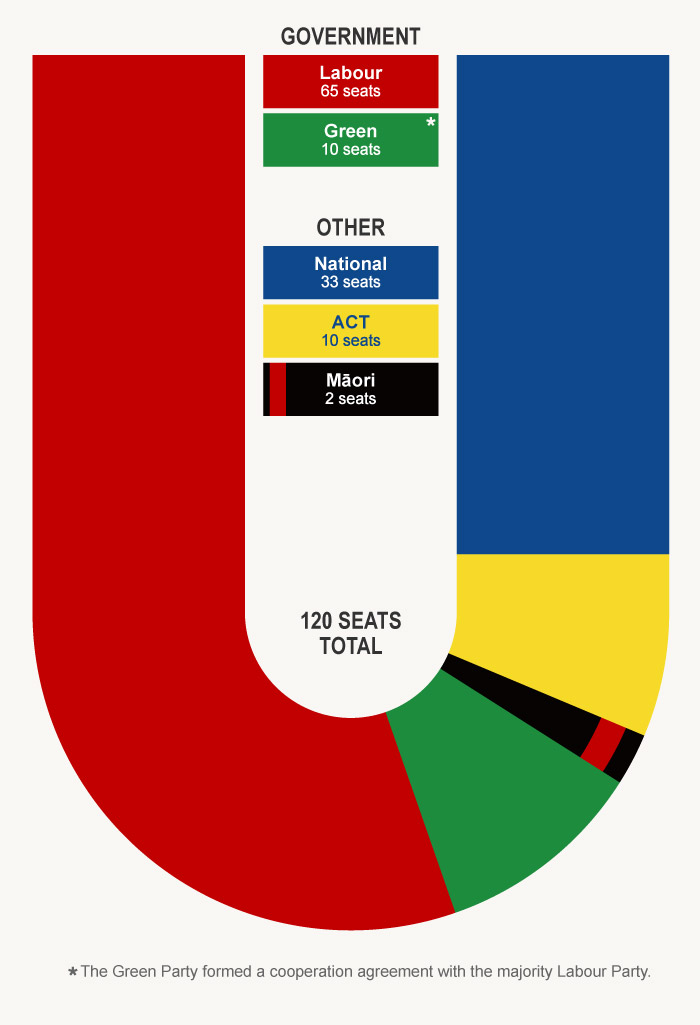
This diagram shows which parties made it into Parliament and how many seats they held at elections from 1890 to 2023. The ‘U’ shape of the diagram is modelled on the seating in the parliamentary debating chamber, in which the governing party sits to the right of the speaker, who is seated at the open end of the ‘U’.
Using this item
Te Ara - The Encyclopedia of New Zealand
This item has been provided for private study purposes (such as school projects, family and local history research) and any published reproduction (print or electronic) may infringe copyright law. It is the responsibility of the user of any material to obtain clearance from the copyright holder.