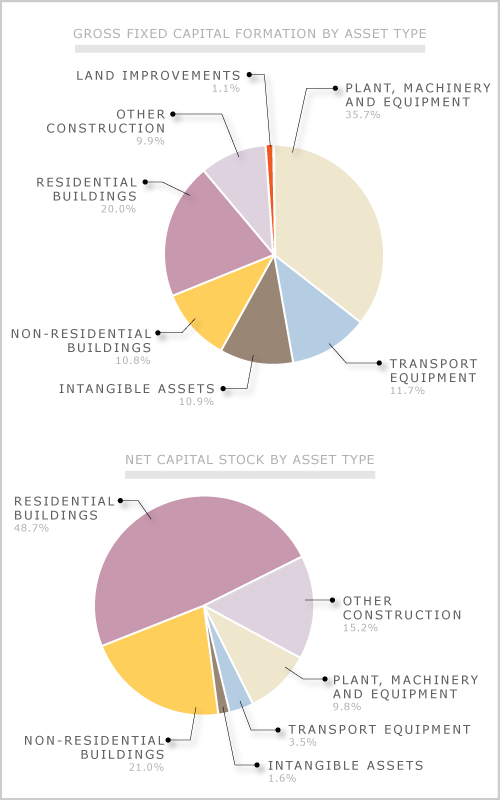
These two graphs show the investment in different types of assets in the year ended March 2007. The top graph represents the gross investment, and the bottom graph shows net investment, taking into account the effect of depreciation – the reduced productive value of the investment over time. The most striking difference between the two graphs is the high proportion of investment in the top graph in plant, machinery and equipment (over a third), which drops to under a tenth in the net investment graph. The reason for this is that equipment gets worn out and obsolete rapidly so it suffers from a high rate of depreciation. By contrast houses and buildings depreciate much more slowly so that all buildings (both residential and other buildings) constitute over two-thirds of the net investment.
Te whakamahi i tēnei tūemi
Te Ara – The Encyclopedia of New Zealand

This item is licensed under a Creative Commons Attribution-NonCommercial 3.0 New Zealand Licence
Source: Statistics New Zealand


Tāpiritia te tākupu hou