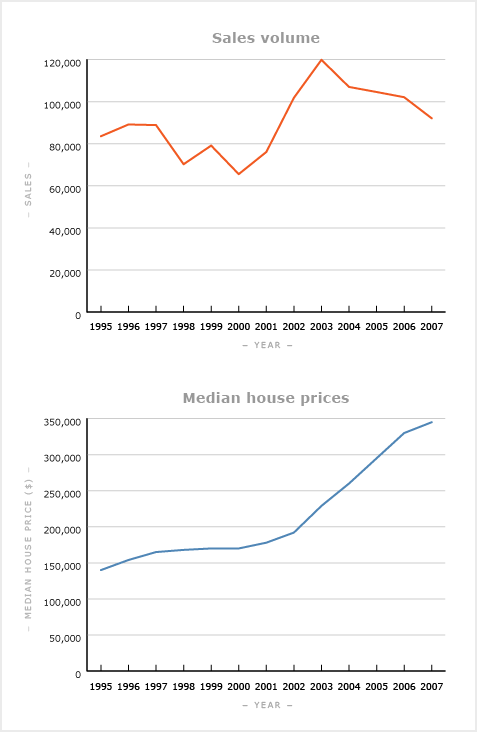
The top graph shows the annual volume of house sales transacted by real estate agents from 1995 to 2007. The bottom graph shows the median sale price for houses over the same period.
After a period of volatility, sales volumes climbed steadily from 2000 to a peak in 2003, then began to decline. Median prices increased over the period, with particular gains from 2002 to 2007.
Using this item
Te Ara - The Encyclopedia of New Zealand

This item is licensed under a Creative Commons Attribution-NonCommercial 3.0 New Zealand Licence


Add new comment